Virsical FM x Feishu: Embedding the Operations Dashboard into Your Workflow
How many work orders are backlogged? Which inspection points have been completed? What is the schedule for next month's preventive maintenance plan? Are the equipment operating normally right now? — These are questions that operations supervisors ask every day. But the answers are often buried deep in professional systems, requiring login, queries, exports, and then screenshots sent to group chats.
With the deep integration of Virsical FM and Feishu, all of this has changed dramatically. The FM dashboard is no longer a functional module buried deep in the system, but a real-time dashboard that can be accessed at any time, automatically pushed, and embedded into the Feishu workspace. Data finds people, not the other way around.
Virsical FM: The "Data Hub" for Facility Operations
As a professional facility management platform, Virsical FM (MetaFM) covers the entire end-to-end spectrum of enterprise facility operations:
- Work Order Management: Repair response, task assignment, completion closure, timeout alerts;
- Inspection Management: Inspection plans, point execution, anomaly reporting, traceability;
- Preventive Maintenance Management: Equipment records, maintenance cycles, historical records, due-date reminders;
- Equipment Management: Equipment register, operational status, fault records, lifecycle management;
- Additional Modules: Inventory management, supplier management, contract management, energy data, etc.
These modules generate massive amounts of operational data every day—the "pulse" of facility management. The function of the Virsical FM dashboard is to transform this data into intuitive charts, dashboards, and cards, giving managers a clear view of the overall facility operation status.
Integration with Feishu: The FM Dashboard "Steps Out" of the System and Into Daily Work
Virsical has formed a close strategic partnership with Feishu, deeply integrating with the Feishu ecosystem. When the FM dashboard meets Feishu, a remarkable chemistry occurs:
1. Minimal Entry Point: One Click from the Feishu Workspace
Employees no longer need to remember complex system addresses or perform additional logins. In the Feishu workspace, simply click the Virsical app to access the dedicated FM dashboard. From office collaboration to facility management, it's just one click away.
2. Messages as Dashboards: Proactive Push of Critical Data
Feishu's messaging capabilities are deeply integrated with the FM dashboard. When a work order remains unprocessed past its deadline, when an inspection task is about to become due, when equipment requires maintenance—the FM dashboard's alerts are automatically pushed to the responsible person via Feishu messages. No need to monitor the backend; data proactively finds you.
3. Multi-Dimensional Table Integration: Data That Can Be Analyzed and Reprocessed
Virsical FM data can be synced in real time to Feishu multi-dimensional tables. This means that beyond the FM dashboard itself, you can leverage the customization capabilities of multi-dimensional tables for secondary analysis. Equipment failure rate trends, work order type distribution, inspection completion rates—these insights can be presented either in the native FM dashboard or embedded in Feishu documents, shared in groups, or pinned to the desktop.
Virsical FM Dashboard: Four Core Scenarios, Controlled from One Screen
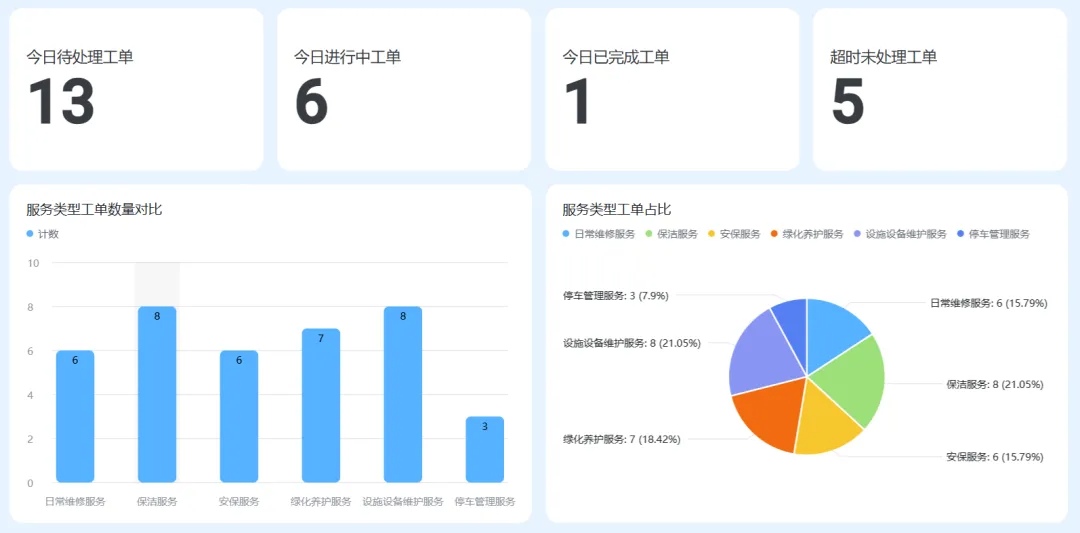
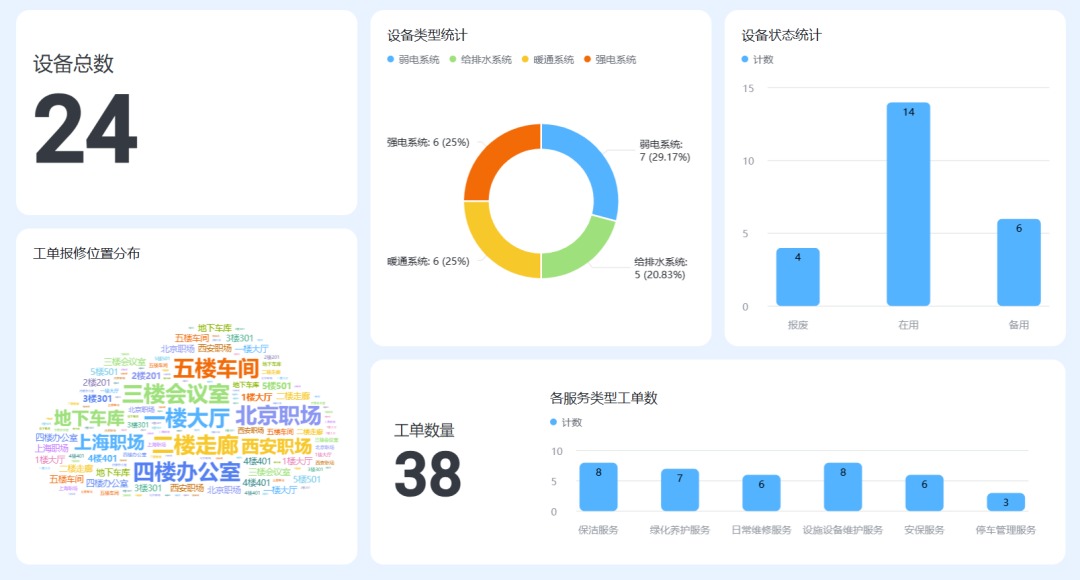
Scenario 1: Work Order Statistics Dashboard – Service Efficiency at a Glance
Within the work order management module of Virsical FM, the dashboard can display in real time:
- Today's Work Order Overview: Number pending, in progress, and completed –一目了然 (clear at a glance) with card visuals;
- Response Time Analysis: Average response duration and average completion duration, grouped by type or region for comparison;
- Work Order Distribution Statistics: Air conditioning repairs, lighting failures, IT support – pie chart showing the proportion of each issue type;
- Overdue Work Order Alerts: Red highlighting for work orders that are overdue and unprocessed, with one-click follow-up.
Value: Managers can open Feishu and immediately know where the day's service pressure lies. During weekly reviews, trend charts are automatically generated – no manual aggregation needed.
Scenario 2: Inspection Task Dashboard – Full Transparency of Execution Status
The difficulty of inspection work lies in knowing "whether the inspection was done" and "how well it was done." The Virsical FM inspection dashboard solves this problem:
Today's Inspection Progress: Displays completed points / total points using a progress bar, motivating the team to complete on time;
Regional Completion Status: Grouped by floor or area – areas lagging behind are immediately flagged in red;
Anomaly Reporting Statistics: Anomalies discovered during inspections are aggregated by type for easy follow-up;
Personnel Performance Dashboard: Each inspector's task completion count, average time taken, and number of anomalies found – objectively quantified.
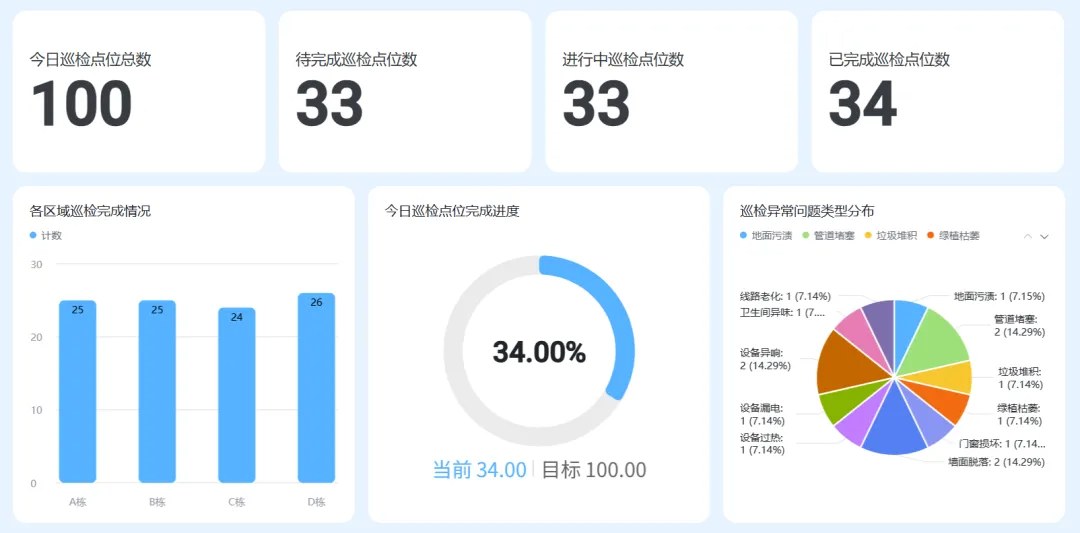
Value: Supervisors no longer need to repeatedly ask for status – just open the dashboard to see who is executing efficiently and where support is needed.
Scenario 3: Preventive Maintenance Task Dashboard – Ensuring Proactive Maintenance
The core of equipment maintenance is "execution on time, traceable records." The Virsical FM maintenance dashboard keeps everything organized:
- Maintenance Calendar: Displays maintenance tasks due this month and next month in a calendar view – no milestone missed;
- Equipment Health Record: Click any equipment to view its maintenance history, next maintenance date, and total maintenance count;
- Cycle Alerts: When equipment is approaching its maintenance cycle, the dashboard automatically marks it as "due soon";
- Cost Analysis: Tracks maintenance costs for each piece of equipment, providing data support for replacement decisions.
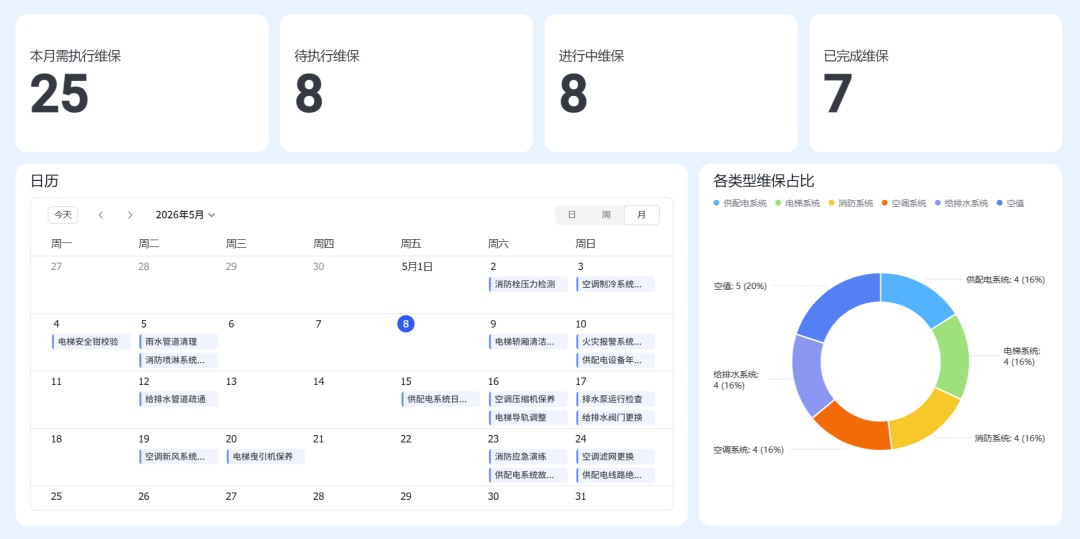
Value: Shifting from "fix when broken" to "maintain proactively" – the dashboard makes preventive maintenance truly achievable.
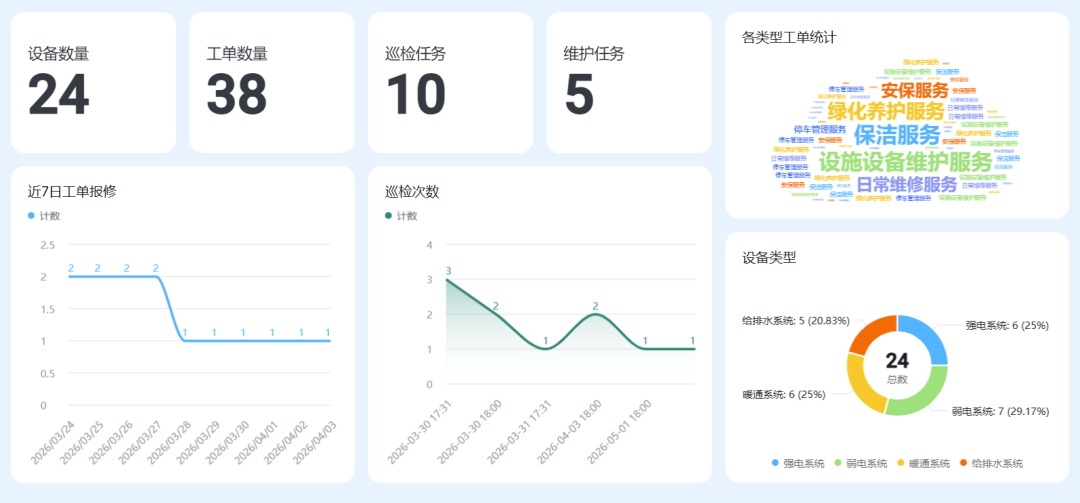
Scenario 4: Equipment Management Dashboard – Full Lifecycle Control in Your Hands
Equipment is the core asset of facility operations. The Virsical FM equipment management dashboard gives you clear visibility into the status of every piece of equipment:
- Equipment Register Overview: Total number of equipment company-wide, online count, offline count, fault count – card-style statistics give you an immediate sense of asset scale;
- Equipment Distribution by Type: Displays quantity proportions by type (air conditioning, elevators, lighting, security, etc.), facilitating categorized management;
- Failure Rate Ranking: Tracks fault frequency for each piece of equipment, presenting a "Top 10 High-Failure Equipment" bar chart to precisely locate problem equipment;
- Spare Parts Association Analysis: Links equipment with spare parts inventory – click any equipment to view the stock status of required spare parts, avoiding "no parts available" during repairs.
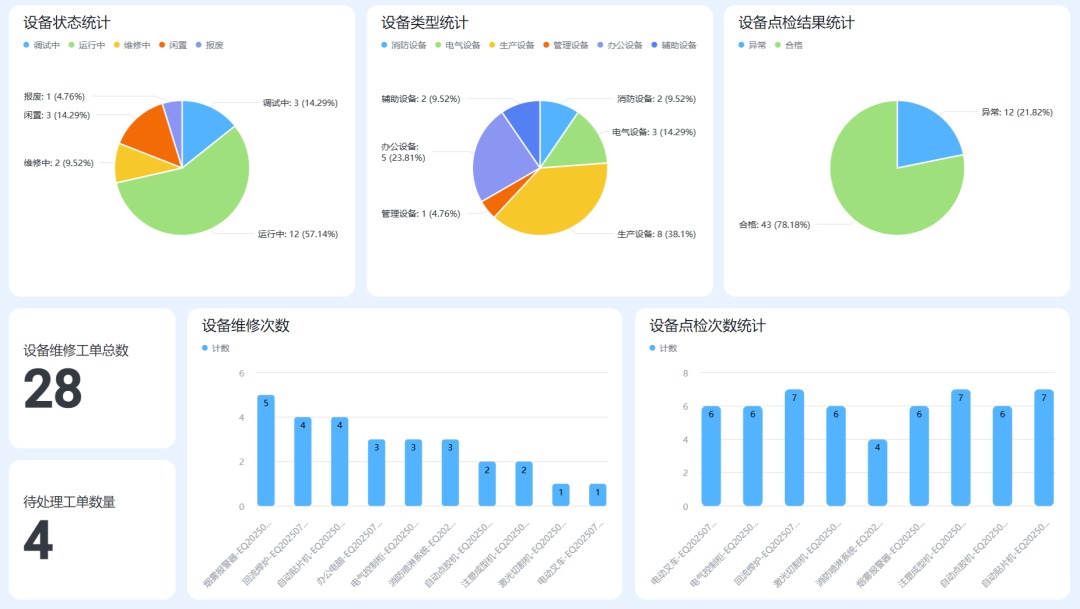
Value: Full lifecycle data traceability from equipment commissioning to disposal; high-failure equipment is clearly identified, providing a basis for procurement decisions; real-time operational status monitoring with proactive anomaly alerts, preventing problems before they occur.
Beyond Viewing: Three Advanced Capabilities of the FM Dashboard
1. Granular Permission Control
Different roles see different dashboard views:
Operations Director: Global dashboard, overview of the entire operations landscape (including equipment management summary);
Engineering Supervisor: Execution dashboard for their assigned area, tracking progress and equipment faults;
Frontline Engineer: Personal task dashboard and status view of assigned equipment.
2. Real-Time Data Synchronization
Whenever data is updated in the Virsical FM backend, the dashboard refreshes simultaneously. As work orders are completed, the completion rate changes instantly; as inspections are reported, the progress bar advances automatically; as equipment status changes, the operations dashboard updates in real time. What you see at every moment is the true state of the present.
3. Historical Data Traceability
All work orders, inspections, maintenance records, and equipment records are automatically archived, supporting filtering by time, type, responsible person, equipment ID, and other dimensions. Need to review the fault history of a specific piece of equipment? Need to calculate the mean time between failures (MTBF) for a certain equipment type? A few clicks in the dashboard and the results appear instantly.
From "System Reports" to "Management Dashboards"
In the past, we used to say, "let me check the reports in the system." Now, the FM dashboard is already integrated into every corner of the Feishu workspace.
• It can be the workspace card that pops up first when you open Feishu each morning, showing today's equipment status and pending work orders.
• It can be a real-time dashboard screenshot you share in group chats to keep the team synchronized on operations progress.
• It can be an automatically embedded data chart in weekly meeting documents, letting facts speak.
• It can be an automated message alert triggered by equipment anomalies, delivered directly to the responsible person.
The deep integration between Virsical FM and Feishu ensures that facility management data is no longer trapped in the silo of a professional system, but truly becomes part of enterprise collaboration.
Now, Let the FM Dashboard "Live" Inside Your Feishu
If you are already using Virsical FM to manage facility operations, we invite you to experience the new capabilities enabled by its integration with Feishu:
- One-Step Integration: Data from various Virsical FM modules can be integrated into Feishu multi-dimensional tables;
- Multi-Device Synchronization: Real-time data consistency across PC and mobile devices, accessible anytime, anywhere;
- Customizable Extensions: If more flexible analysis is needed, data can be synced to Feishu multi-dimensional tables to freely build your own custom dashboard.
Let data serve management, and let the dashboard empower decision-making. Virsical FM × Feishu: Ushering in a new era of visualized facility operations.